FiveThirtyEight: Tracking the Polls and Forecasting the Election

Search

Breaking Bad Snob
Joined
Dec 5, 2004
Messages
13,430
Tokens
This will be an ongoing thread containing the entries of Nate Silver's blog FiveThirtyEight.

I'm sure most of you already know about FiveThirtyEight, but here's a little background.

From Wikipedia:

During the U.S. presidential primaries and general election of 2008, the site compiled polling data through a unique methodology derived from Silver's experience in baseball sabermetrics to "balance out the polls with comparative demographic data" and "weighting each poll based on the pollster's historical track record, sample size, and recentness of the poll".

In the final update of his presidential forecast model at midday of November 4, 2008, Silver projected a popular vote victory by 6.1 percentage points for Barack Obama and electoral vote totals of 349 (based on a probabilistic projection) or 353 (based on fixed projections of each state). Silver's predictions matched the actual results everywhere except in Indiana and the 2nd congressional district of Nebraska, which awards an electoral vote separately from the rest of the state. His projected national popular vote differential was below the actual figure of 7.2 points.

The forecasts for the Senate proved to be correct for every race.​
 

Member
Joined
Jul 14, 2007
Messages
31,503
Tokens
This will be an ongoing thread containing the entries of Nate Silver's blog FiveThirtyEight.

I'm sure most of you already know about FiveThirtyEight, but here's a little background.

From Wikipedia:

During the U.S. presidential primaries and general election of 2008, the site compiled polling data through a unique methodology derived from Silver's experience in baseball sabermetrics to "balance out the polls with comparative demographic data" and "weighting each poll based on the pollster's historical track record, sample size, and recentness of the poll".

In the final update of his presidential forecast model at midday of November 4, 2008, Silver projected a popular vote victory by 6.1 percentage points for Barack Obama and electoral vote totals of 349 (based on a probabilistic projection) or 353 (based on fixed projections of each state). Silver's predictions matched the actual results everywhere except in Indiana and the 2nd congressional district of Nebraska, which awards an electoral vote separately from the rest of the state. His projected national popular vote differential was below the actual figure of 7.2 points.

The forecasts for the Senate proved to be correct for every race.​

FiveThirtyEight is awesome, really good source.

Silva's article on why he doesn't see Michigan as a swing state currently was pretty good.
 

Breaking Bad Snob
Joined
Dec 5, 2004
Messages
13,430
Tokens
1-3.jpg

2-3.jpg

3-2.jpg

4-2.jpg


http://fivethirtyeight.blogs.nytimes.com/
 

Member
Joined
Jul 14, 2007
Messages
31,503
Tokens

While I do like his data and I'm into analytics. I'd probably put Obama's chances of winning a state he didn't carry in '08 to be at a lot less than 21%. I dunno, be VERY surprised if that happened. That would pretty much signal a huge ass whooping and I don't really see that.
 

Breaking Bad Snob
Joined
Dec 5, 2004
Messages
13,430
Tokens
Sept. 1: Romney’s Convention Bounce Appears Middling So Far

The Republican National Convention in Tampa, Fla. received mediocre television ratings — and the polling data so far suggests that it may produce only a modest bounce in the polls for Mitt Romney.

The most favorable number for Mr. Romney is from the Rasmussen Reports tracking poll. That survey showed him pulling into a 3-point lead against President Obama on Saturday. All of the interviews in the Rasmussen poll were conducted after the convention began, although only about one-third were conducted after Mr. Romney’s acceptance speech on Thursday night.

The Rasmussen poll represents a 5-point swing toward Mr. Romney from the polling firm’s final survey before the conventions, when it had Mr. Obama ahead by two points. But it does not read quite as strongly for him as compared to the long-term average of Rasmussen polls, which have had Mr. Romney ahead by about one percentage point on average over the past 60 days.

Another survey, an online tracking poll conducted by the polling firm Ipsos, had previously shown a decent-sized bounce for Mr. Romney — but it has since receded some. In the version of the poll that Ipsos released on Saturday, Mr. Obama led by one percentage point, 44-43, among likely voters. That’s a better result for Mr. Romney than the survey the firm conducted prior to the conventions, when Mr. Romney had trailed by four points. But it reflects a reversal from Thursday, when Mr. Romney was up by two points in the poll.

The most sluggish of the tracking polls is from Gallup, which reports its results over a lengthy seven-day window. That means that only about half its interviews occurred after the start of the convention, and a smaller fraction than that will represent people surveyed after Mr. Romney’s acceptance address.

However, the trend so far in the Gallup poll is a bit disappointing for Mr. Romney; the survey still shows Mr. Obama one point ahead. By comparison, the Gallup poll has had a 46-46 tie on average over the past 60 days.

We’ll need to wait another day or two before we can make a more confident judgement on the size of Mr. Romney’s bounce, but the information we have so far points toward its being a little underwhelming.

The FiveThirtyEight “now-cast”, which does not adjust for the bounces associated with the party conventions, estimates that Mr. Obama would have a 72.3 percent chance of winning if the election were held today. That’s essentially unchanged from before the conventions, when the number had ranged between about 70 percent and 74 percent.

One way to interpret the trend in the “now-cast” is that, so far, Mr. Romney’s bounce is hard to distinguish from the statistical noise that we ordinarily see in polls. Based on the data that they published on Saturday, Mr. Romney’s standing in the Rasmussen poll was two points better than its 60-day average, but it was one point worse than average in the Gallup poll.

The FiveThirtyEight forecast, which penalizes a candidate in its evaluation of polls conducted just after his party convention, interprets the data as being slightly negative for Mr. Romney. On Saturday, Mr. Obama’s chances of winning the Electoral College rose to 73.1 percent in the forecast, its highest figure since Aug. 16, when it was 73.6 percent.

But whatever assumptions you make about a convention bounce, it introduces more noise into the polling. Both the forecast and the “now-cast” are therefore likely to be more unstable than usual over the next week or two, and they should be interpreted with plenty of caution.

If Mr. Romney’s bounce turns out to be mediocre, the pressure will then be on Mr. Obama. If the polls fail to move much in his direction after the Democratic convention in Charlotte, N.C., the gains he has made in the FiveThirtyEight forecast over the past few days will be reversed.
 

Member
Joined
Sep 22, 2007
Messages
22,991
Tokens
FiveThirtyEight is awesome, really good source.

Silva's article on why he doesn't see Michigan as a swing state currently was pretty good.

Yup, in 2008, they were very accurate in calling for Obama to win the primaries when a lotta other sources were hollering about Hillary. Notice how the expectancy for Obama has increased in recent days. I like pollster.com quite a bit, als.
 

Member
Joined
Jul 14, 2007
Messages
31,503
Tokens
Yup, in 2008, they were very accurate in calling for Obama to win the primaries when a lotta other sources were hollering about Hillary. Notice how the expectancy for Obama has increased in recent days. I like pollster.com quite a bit, als.

Yeah just looked at the electoral a little closer. While I do think 538 is a good source, its tough not to take their 72/28 prediction with a grain of salt when they got Obama at 21% to win a state he didn't in '08. Personally, I got the odds on that happening at about .0000003% myself.
 

Breaking Bad Snob
Joined
Dec 5, 2004
Messages
13,430
Tokens
Yeah just looked at the electoral a little closer. While I do think 538 is a good source, its tough not to take their 72/28 prediction with a grain of salt when they got Obama at 21% to win a state he didn't in '08. Personally, I got the odds on that happening at about .0000003% myself.

Obama barely lost Missouri in 2008. It was all but assured that he was going to lose there in November, but with Akin accidentally saying out loud what many Republicans believe, I believe there is now a 20% chance Obama can take it back.
 

Member
Joined
Sep 22, 2007
Messages
22,991
Tokens
Yeah just looked at the electoral a little closer. While I do think 538 is a good source, its tough not to take their 72/28 prediction with a grain of salt when they got Obama at 21% to win a state he didn't in '08. Personally, I got the odds on that happening at about .0000003% myself.

I think the following article on pollster was pretty informative about the 3 key states:

http://www.huffingtonpost.com/david-rothschild/three-states-keys-election_b_1840321.html
 

Breaking Bad Snob
Joined
Dec 5, 2004
Messages
13,430
Tokens
Obama barely lost Missouri in 2008. It was all but assured that he was going to lose there in November, but with Akin accidentally saying out loud what many Republicans believe, I believe there is now a 20% chance Obama can take it back.

Oh well, scratch that. He has Obama with a 12% chance to win Missouri.
 

Breaking Bad Snob
Joined
Dec 5, 2004
Messages
13,430
Tokens

Member
Joined
Sep 22, 2007
Messages
22,991
Tokens
So according to that, Obama only has to win one out of Virginia, Florida and Ohio.

Silver has Obama's chances at 69%, 56%, and 71% respectively. Unless something goes horribly wrong, those numbers should improve after the convention.

Yup, to say nothing after the debates. And, Ohio being the biggest fav, especially after the Repubs' disgrace hour cutting scam was shot down, is not insignificant:

http://fivethirtyeight.blogs.nytimes.com/2012/08/30/aug-29-so-much-depends-upon-ohio/
 

Member
Joined
Jul 14, 2007
Messages
31,503
Tokens
So according to that, Obama only has to win one out of Virginia, Florida and Ohio.

Silver has Obama's chances at 69%, 56%, and 71% respectively. Unless something goes horribly wrong, those numbers should improve after the convention.

While Silver's '08 predictions are impressive (he pretty much nailed everything)
He isn't accounting for how positively correlated the states are I don't believe.
 

Breaking Bad Snob
Joined
Dec 5, 2004
Messages
13,430
Tokens
While Silver's '08 predictions are impressive (he pretty much nailed everything)
He isn't accounting for how positively correlated the states are I don't believe.

I'm not sure that we know exactly everything that goes into his formula. I would be surprised if positive correlations were not accounted for.
 

Conservatives, Patriots & Huskies return to glory
Handicapper
Joined
Sep 9, 2005
Messages
85,891
Tokens
Silver does a good job using polls to predict outcomes, I respect that. RCP polling summaries do likewise without making any adjustments.

However, when you start speculating about trends from now to election day you're moving into subjectivity territory. The campaign is only beginning, the money is now going to be spent, America will start paying more attention.

every election has different variables, and there is no formula to determine what variables will carry more weight. That's just a wild ass guess.

as we get closer to election day, every pollster is pretty good at picking the winner
 

Member
Joined
Sep 22, 2007
Messages
22,991
Tokens
I'm not sure that we know exactly everything that goes into his formula. I would be surprised if positive correlations were not accounted for.

Agreed. Also hard to quantify, I would think, is the fact that the more people get to know Williard, the less they like him. Bottom line, if the challenging parties numbers go DOWN overall after their own convention and prior to the incumbent's, well, in the words of that nerdy looking sportscaster on ESPN, Neil something or other, "Is that bad? It ain't good!"
 

Breaking Bad Snob
Joined
Dec 5, 2004
Messages
13,430
Tokens
Sept. 2: Split Verdict in Polls on Romney Convention Bounce

My view is that the consensus of evidence so far points toward Mitt Romney having received a small bounce in the polls of perhaps two or three percentage points from the Republican convention in Tampa, Fla.

Oddly enough, however, you can’t really find a poll that seems to reflect a 2- or 3-point bounce exactly. Instead, there have been some polls where Mr. Romney’s bounce has been a bit larger than that, and others where there is little sign of a bounce at all.

On the favorable side for Mr. Romney is the Rasmussen Reports tracking poll, which now shows him four percentage points ahead of President Obama. That represents a 6-point swing toward Mr. Romney compared with the poll Rasmussen Reports released immediately before the convention, although the bounce is smaller (about three percentage points) measured relative to the long-term average of their surveys.

An online national tracking poll from Ipsos also shows a bounce for Mr. Romney, although its magnitude has been shifting a bit from day to day. Based on the latest iteration of the poll, the race is now tied among likely voters at 45 percent each, reflecting a 4-point swing toward Mr. Romney from Ipsos’s poll before the convention. And the shift has been larger — a net of seven percentage points toward Mr. Romney — in the version of the poll that tracks the preferences of registered voters instead.

But there are also two clearly unfavorable data points for Mr. Romney. One is the Gallup national tracking poll, which still shows Mr. Obama with a 1-point lead — actually a bit worse for Mr. Romney than Gallup’s last survey before the convention, when he had led by one point.

Gallup’s survey still contains a fair number of interviews that were conducted before the convention began, and there is a bit of a silver lining for Mr. Romney in that Mr. Obama’s approval rating ticked down in the poll on Sunday. Since Gallup’s approval ratings are based on a 3-day polling average while their horse race numbers are based on a 7-day average, that could indicate Mr. Romney may still gain a bit of ground in the poll once it fully rolls over to post-convention interviews.

On the other hand, Gallup’s Frank Newport suggested in a blog post on Sunday night that polling asking voters for their views of Mr. Romney’s speech had produced evaluations “at the very low end of the scale” as compared with previous acceptance addresses. In any event, if Mr. Romney’s bounce had been more emphatic, it would be a little easier to find right now.

The other bad numbers for Mr. Romney are in a pair of surveys that Public Policy Polling released Sunday night. In those surveys, Mr. Obama held a 1-point lead in Florida, while the two candidates were exactly tied in North Carolina.

Those numbers are broadly consistent with how Public Policy Polling had been showing the races in those states previously, although you can argue that there has been a shift of a point or so toward Mr. Romney depending on what baseline you choose. And it is always worth remembering that Public Policy Polling’s surveys have been a bit Democratic-leaning this cycle — by about one or two percentage points relative to the consensus.

Still, I do not think we should be interpreting these Public Policy Polling surveys as anything other than poor data points for Mr. Romney. A Republican candidate who was essentially tied in slightly red-leaning states like North Carolina and Florida in polls conducted immediately after his convention would be in some trouble.

Fortunately for Mr. Romney, another North Carolina survey out on Sunday night, from Elon University for the Charlotte Observer, had somewhat better numbers for him there, giving him a 4-point lead among likely voters. This is their first survey of the state this year so there are no trendlines for comparison, but since our forecast model had been showing Mr. Romney as a 1- or 2-point favorite in North Carolina before the conventions, this result seems fairly consistent with a 2- or 3-point bounce for him.

It is important to remember that there is quite a bit of noise in the polls based on statistical variance, along with the methodological choices that different polling companies make. It would be nice if every poll showed a nice, tidy bounce of about the same magnitude for Mr. Romney, but rarely are the polls so well behaved.

Our forecast model builds in an adjustment for the party conventions; it treats anything larger than a 4-point bounce as being a favorable sign for Mr. Romney, and anything smaller than that as being an unfavorable one.

This could change as we get more data, but for the time being it looks like Mr. Romney’s bounce will be a bit shy of that 4-point threshold. Thus, the forecast has moved toward Mr. Obama over the past few days; it now gives him a 74.5 percent chance of winning the Electoral College, his highest figure to date.

Our “now-cast”, however, which does not build in an adjustment for the conventions, moved slightly toward Mr. Romney on Sunday. Its estimate is that he would have a 29 percent chance of winning the Electoral College in an election held today, up from 27.7 percent on Saturday.

In other words, the polling over the past few days would look slightly favorable for Mr. Romney under ordinarily circumstances, but it reads somewhat bearishly for him given that candidates typically have modestly inflated numbers after their party conventions.

The real action, however, will be after the Democratic convention in Charlotte, N.C., when the expectation built into the forecast is that Mr. Obama will post numbers that are a point or two better than his long-term averages.


29fivethirtyeight-bounce-custom1.gif


Something in the neighborhood of a 4-point lead for Mr. Obama in national polls and polls of key states conducted just after Charlotte would be in line with these expectations. If Mr. Obama has an advantage in the mid-to-high single digits instead, that will start to look problematic for Mr. Romney, whereas, if the race is roughly tied or Mr. Obama leads by only a point or so, Mr. Romney may credibly claim to have gotten the better of the conventions despite having a relatively small bounce himself.

But the one eventuality we probably can take off the table is the notion that Mr. Romney would emerge from his convention with unmistakable momentum, as Ronald Reagan did in 1980 or Bill Clinton did in 1992. His bounce may turn out to be “just fine” once we see a few more polls, and how the numbers move after Charlotte. But Mr. Obama is unlikely to make it easy for Mr. Romney.
 

Breaking Bad Snob
Joined
Dec 5, 2004
Messages
13,430
Tokens
In Looking Back Four Years, Voters Have Short Memories

Are you better off than you were four years ago?


The famous question that Ronald Reagan put to voters in the waning days of the 1980 election was an implicit theme of the Republican National Convention in Tampa, Fla. — and it has received further play since then on the Sunday morning talk shows and on the campaign trail.

It’s a smart question for Mitt Romney’s campaign to be asking, and one that President Obama needs to develop a better answer to.

Still, it’s probably best not to take the question literally. If voters did, Mr. Reagan might never have been elected.

Since there are so many ways to define what “better off” means, I’m going to limit the discussion to one particular measure: jobs, as tracked by the government’s monthly nonfarm payrolls report. (Certainly it’s worth remembering that in 1980, Jimmy Carter had a whole host of problems apart from sluggish jobs growth, including extremely high inflation and the hostage crisis in Iran.)

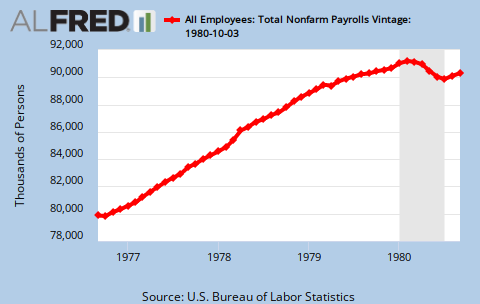
Here’s what a voter would have been looking at on Election Day, 1980. These were the jobs numbers as they were reported in real time by the government, covering exactly four years’ worth of reports from September 1976 through September 1980. (The September report, published on Oct. 3, 1980, was the last one before the election that year.)

alfredgraph.png


There was actually quite a bit of jobs growth during this four-year period: about 10 million jobs were added to the economy, in fact. The first two years of Mr. Carter’s term, 1977 and 1978, were particularly robust years for employment.

But the economy began to slow down in 1979 and was in acute crisis mode by 1980, having lost about 1.5 million jobs from its previous peak. The economy technically came out of recession late that year, but there was enough of a hangover from the summer that Mr. Carter was doomed to be a one-term president.

Regardless, Mr. Reagan would not have wanted voters to provide a literal answer to his question. If they had actually been considering their situation in late 1980 and comparing it with what they had experienced in late 1976, many of them would have found that they were a little better off. (Their answer may have depended on how much they weighed inflation against other factors.)

But were voters better off than they had been one year ago? That question had a more straightforward answer: probably not. And that’s why so many of them voted for Mr. Reagan.

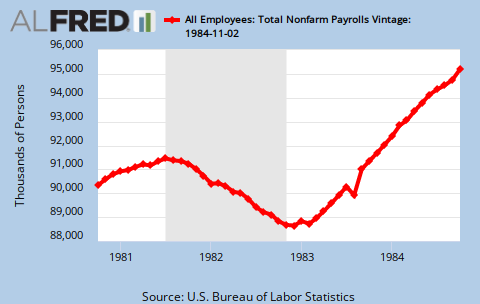
Almost the opposite circumstance occurred just four years later, when Mr. Reagan was running for a second term. The next chart shows the jobs numbers from October 1980 through October 1984, as they were reported in real time to voters:

alfredgraph.png


The economy certainly improved on balance under Mr. Reagan — there were about 95 million payroll jobs in the country when voters went to the polls in November 1984, as compared with about 90 million four years earlier.

Still, that was only about half as many jobs as were added in the four years leading up to Mr. Carter’s losing election night in 1980.

What mattered, of course, was the trend: Mr. Reagan had gotten his recession out of the way early. From an employment standpoint, the recession of 1981-82 was actually more severe than the 1980 one: about 2.5 million jobs were subtracted.

But jobs growth in 1983 and 1984 was pretty awesome; about 250,000 jobs were added to the economy each month as reported in real time.

These two back-to-back election cycles represent the most emphatic examples of a point that macroeconomic forecasting models are absolutely agreed upon: it’s recent economic performance that matters.

The evidence here is very strong. It wasn’t like Mr. Reagan just squeezed by Walter Mondale in 1984, or that Mr. Carter came all that close to winning another term. And yet, economic growth was pretty comparable as measured under their full four-year tenures. It was all about the timing. (By some measures, the correlation between economic performance in the first two years of a president’s term and his election results is actually negative.)

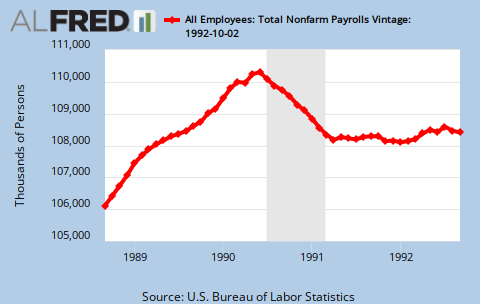
There are other examples of this pattern. Under the tenure of Mr. Reagan’s successor, George H.W. Bush, the economy added jobs. But all of that growth had been back-loaded into his first year in office, 1989. The economy went into a recession in 1990, and although other measures of it were in recovery mode by mid-1991, the jobs numbers just weren’t. Instead, jobs were about two million below their peak when voters went to the polls in 1992. (Revised numbers show a bit more jobs growth, but voters making a decision in November 1992 weren’t privy to those numbers.)

alfredgraph.png


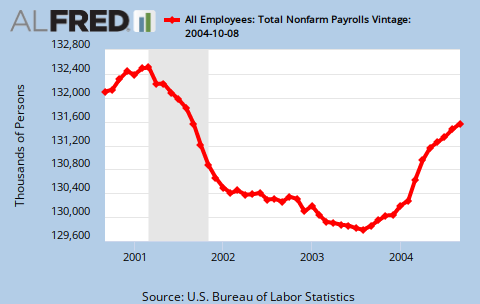
Another case is 2004, when George Bush the younger was in office. Through mid-2003, the economy had actually lost quite a lot of jobs, about four million, based on the real-time numbers. But it picked up just in the nick of time, adding about 150,000 jobs per month in the final 12 reports published in advance of the election. That was enough for Mr. Bush to win a narrow re-election — despite the economy actually having shed jobs from four years earlier (as well as from the date of his inauguration in 2001).

alfredgraph.png


The last four years of jobs numbers don’t look exactly like any of these cases. For one thing, it matters quite a bit exactly what you mean by “four years,” since the economy was in free-fall in late 2008 and early 2009.

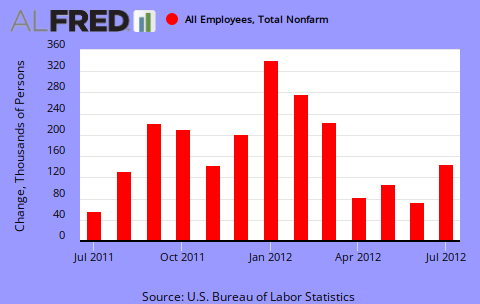
As compared with July 2008, there were about four million fewer jobs in the economy as of July 2012.

fredgraph.png


Of course, Mr. Obama might object that he is being blamed for job losses under Mr. Bush. If you start his clock as of his inauguration in January 2009 instead, the economy is fairly close to having made up the jobs it lost — the last three jobs reports before this November’s election will determine whether it clears that hurdle.

fredgraph.png


Or, Mr. Obama might prefer voters to focus on jobs growth since the recession officially ended in June 2009. Since that time, about 2.5 million jobs have been added.

fredgraph.png


Still, the job growth has been tenuous: nowhere in the ballpark of what Mr. Reagan produced, certainly. There’s never even been a moment in Mr. Obama’s tenure where the term “good” could aptly be applied to describe the economy.

But there has been some jobs growth: quite a bit more than under the elder Mr. Bush.

Instead, 2004 is probably the least imperfect precedent. In the past 12 employment reports, the government estimates that an average of 153,000 jobs have been added each month, similar to the pace of jobs growth in late 2003 and 2004.

alfredgraph.png


Certainly, a lot has been baked into the economic cake by now: the economy hasn’t grown enough to make a landslide win for Mr. Obama a realistic possibility, but there has been just enough growth that he probably won’t be blown out either. (Our forecast model evaluates the economic numbers as being just favorable enough to make him a slight favorite on that basis.)

But Mr. Obama’s fate could hinge on the last three months of jobs numbers — including the report on Friday, which will come the morning after his speech to the Democratic convention in Charlotte, N.C.

Talk about accidents of timing: Mr. Obama’s words in Charlotte are suddenly going to seem a lot more inspired if the next morning we find out that 200,000 jobs had been added in September. If the employment report is a dud instead, his speech will seem much emptier, both to pundits and to voters.

But it will be the recent news that they are thinking about — not what happened four years ago. The question that voters have been more inclined to ask in past elections is this one: what have you done for me lately?
 

Breaking Bad Snob
Joined
Dec 5, 2004
Messages
13,430
Tokens
Sept. 3: Par or Bogey?

We’re reaching the point of diminishing returns in analyzing Mitt Romney’s convention bounce. But we can say two things almost for certain. First, Mr. Romney very probably got a bounce. And second, it’s a below-average bounce by historical standards.

What’s trickier to figure out is whether the bounce failed to live up to reasonable expectations, in a way that ought to reduce the odds we’d assign to Mr. Romney winning the election in November.

First, let’s try a simple way of measuring the bounce. In the table below, I’ve included every poll that has been released since Mr. Romney’s acceptance speech last Thursday which also released a preconvention baseline for comparison.

There is some noise in this data: Mr. Romney gets everything from a seven-point bounce (in a Public Policy Polling survey of Michigan) to what technically is an “anti-bounce” of negative two points (in the Gallup national tracking poll). But if you just average the polls together, it comes out to a three-point gain.

rncb1-popup.jpg


A slightly more robust method is to compare the current polling against the long-term trend in each survey. Since the polling has been very, very stable since May 1, I’ve simply averaged together all the surveys that the polling firm has conducted between that time and the start of the convention.

In this version, for instance, we’re comparing Mr. Romney’s current lead of four points in the Rasmussen tracking poll against where that poll has normally had him, which is one or two percentage points ahead — rather than against their poll immediately before the convention, which had Barack Obama up by two points.

Ultimately, however, this doesn’t make too much difference: Mr. Romney’s bounce registers as being about two and a half points rather than three.

rncb2-popup.jpg


You can get pickier than this if you like. For instance, in Michigan, I’m comparing a post-convention poll that screened for likely voters with a preconvention poll that did not, which is not totally kosher.

Still, a bounce somewhere in the two-to-three-point range looks about right. Or if you want to play it safe, since we may still get a few more polls on this, it’s probably somewhere in the range of one to four points.

That’s a small bounce by historical standards. If we take Mr. Romney’s bounce to be two and a half points, it would be the third-smallest for a challenger since 1968, behind John Kerry in 2004 (roughly one point) and Mr. Obama in 2008 (about two). By contrast, the average bounce for the challenger since 1968 is around eleven points.

29fivethirtyeight-bounce-custom3.gif


But do you notice a pattern here? The three smallest bounces for the challenging candidates came in the last three elections. Bounces aren’t what they used to be, perhaps because voters are saturated with information months in advance of an election, increased partisanship and sterilized conventions that may have become too polished for their own good.

The catch is that each of these things is a structural factor, and therefore might predict that Mr. Obama won’t get much of a bounce either. Maybe this is just the new normal; the assumption that our forecast model had made in advance of the convention was that Mr. Romney would get only a four-point bounce.

And yet: the incumbent party did itself some good in each of the last three conventions. In 2000, Al Gore pulled ahead of George W. Bush after having trailed him for most of the year. The lead went back and forth in the stretch run of that race, eventually leading to an essentially tied result.

In 2004, Mr. Bush pulled ahead of John Kerry after the conventions — Mr. Kerry had led for much of the summer — and never relinquished that lead. This is the “glide path” that I’m sure Mr. Obama’s campaign team is hoping for: pull ahead by five or six points after the convention, expect Mr. Romney to cut that to around three points by start of the baseball playoffs, but eventually win a slow-and-steady race that the pundits will describe as “never quite as close as it looked.”

In 2008, the incumbent Republicans had their best stretch in the polls after the convention. In a way, this is a favorable precedent for Mr. Romney as well. That was the only year since 1968 when the challenger (then Mr. Obama) eventually finished with a larger margin of victory than in the polling immediately after his convention.

So I’m a bit torn between the “par” and “bogey” interpretations of the convention for Mr. Romney. It was clearly not a total loss. His campaign has been largely on-message since it left Tampa. There are signs that Mr. Romney’s favorability ratings have perked up a bit, along with his standing among Latino voters.

(Speaking of which, there are the Republican Party’s 2016 prospects to consider: Marco Rubio made a very good debut on the national stage. That he gained stature relative to both Paul D. Ryan and Chris Christie, whose speeches got more mixed reviews, may have been the most important thing to happen in Tampa.)

At the same time, Mr. Romney was trailing in the race — narrowly — heading into the convention. What he really wanted was a birdie, and he didn’t get one.
 

Forum statistics

Threads
1,110,301
Messages
13,468,482
Members
99,535
Latest member
LoriPauley
The RX is the sports betting industry's leading information portal for bonuses, picks, and sportsbook reviews. Find the best deals offered by a sportsbook in your state and browse our free picks section.FacebookTwitterInstagramContact Usforum@therx.com